Back when I was working heavily with LLVM, I learned a bunch of little tricks that made my life so much easier. I meant to document them back when they were fresh in my mind, but didn't get around to it. Now recently I've been chatting with several colleagues at UW that are just getting started with LLVM, and thought I'd go back and put together a couple of the useful tricks I learned.
This also follows on the heels of Adrian's fantastic post on how to get up and running using LLVM for research (which I highly recommend to anyone who ever needs to "do stuff with programs"). Adrian covers all the basics of why LLVM, how to get started, and what some basic passes could look like. The tricks I'll lay out here have more to do with day-to-day debugging tasks.
Debugging with LLDB
Imagine we want to poke around with something in the middle of our custom pass, to inspect how the data structures look, or chase down some bug. LLDB (LLVM's version of GDB) is a fantastic tool for playing with live code. It uses LLVM's formidable JIT tooling to interpret and run arbitrary code you give it (much more robustly than GDB ever has for me). This is extremely powerful especially as you're learning the ins and outs of LLVM's massive codebase.
There's just a couple little tricks to getting LLDB to work nicely for us. First, we need to build with Debug symbols. The best way to do this is to tell CMake to enable Debug symbols. Because CMake is CMake, you need to actually blow away your existing build/ directory and re-configure to change this, this time adding the option -DCMAKE_BUILD_TYPE=Debug:
$ cmake .. -DCMAKE_BUILD_TYPE=Debug
Aside: If you're worried about performance, you could instead use
RelWithDebInfo— this is the setting I recommend for building the rest of LLVM because otherwise it's painfully slow — but for my own code I build withDebugwhile developing.
Let's say we want to play around with the FunctionPass from before and find out more about how Functions are structured. So we want to run our pass with LLDB and set a breakpoint in our code, let's say at line 20, inside our loop over basic blocks.
// In file: Skeleton.cpp
virtual bool runOnFunction(Function& fn) {
  errs() << "In function " << fn.getName() << "\n";

  for (auto& bb : fn) {
    errs() << "Basic block:\n"; // <- line 20
    bb.dump();
  }

  return false;
}
First, we need to find out how to launch Clang with the LLDB debugger. It turns out clang is actually just a driver which figures out how to launch the correct subprocess to do your compile for you. We can see the commands it invokes using clang -v:
$ clang -v -Xclang -load -Xclang skeleton/libSkeletonPass.so ~/scratch/test.c
clang version 3.6.0
Target: x86_64-apple-darwin14.4.0
Thread model: posix
 "/opt/llvm-head/release/bin/clang-3.6" -cc1 -triple x86_64-apple-macosx10.10.0 -emit-obj -mrelax-all -disable-free -disable-llvm-verifier -main-file-name test.c -mrelocation-model pic -pic-level 2 -mdisable-fp-elim -masm-verbose -munwind-tables -target-cpu core2 -v -dwarf-column-info -resource-dir /opt/llvm-head/release/bin/../lib/clang/3.6.0 -fdebug-compilation-dir /Users/bholt/hub/llvm-pass-skeleton/build -ferror-limit 19 -fmessage-length 125 -stack-protector 1 -mstackrealign -fblocks -fobjc-runtime=macosx-10.10.0 -fencode-extended-block-signature -fmax-type-align=16 -fdiagnostics-show-option -fcolor-diagnostics -load skeleton/libSkeletonPass.so -o /var/folders/w6/pf2p4_tx1097_3gc9_dl3yr00009sq/T/test-1c7442.o -x c test.c
 ...
So, now that we know the command (clang-3.6 -cc1 ...), we can run that with LLDB, then we want to set a breakpoint in Skeleton.cpp, line 17 and then we can run the program:
$ lldb -- "/opt/llvm-head/release/bin/clang-3.6" -cc1 -triple x86_64-apple-macosx10.10.0 -emit-obj -mrelax-all -disable-free -disable-llvm-verifier -main-file-name test.c -mrelocation-model pic -pic-level 2 -mdisable-fp-elim -masm-verbose -munwind-tables -target-cpu core2 -v -dwarf-column-info -resource-dir /opt/llvm-head/release/bin/../lib/clang/3.6.0 -fdebug-compilation-dir /Users/bholt/hub/llvm-pass-skeleton/build -ferror-limit 19 -fmessage-length 125 -stack-protector 1 -mstackrealign -fblocks -fobjc-runtime=macosx-10.10.0 -fencode-extended-block-signature -fmax-type-align=16 -fdiagnostics-show-option -fcolor-diagnostics -load skeleton/libSkeletonPass.so -o /var/folders/w6/pf2p4_tx1097_3gc9_dl3yr00009sq/T/test-1c7442.o -x c test.c
(lldb) breakpoint set -f Skeleton.cpp -l 20
Breakpoint 1: no locations (pending).
WARNING:  Unable to resolve breakpoint to any actual locations.
(lldb) run
Process 79186 launched: '/opt/llvm-head/release/bin/clang-3.6' (x86_64)
1 location added to breakpoint 1
clang -cc1 version 3.6.0 based upon LLVM 3.6.0svn default target x86_64-apple-darwin14.4.0
#include "..." search starts here:
#include <...> search starts here:
 /usr/local/include
 /opt/llvm-head/release/bin/../lib/clang/3.6.0/include
 /usr/include
 /System/Library/Frameworks (framework directory)
 /Library/Frameworks (framework directory)
End of search list.
Process 79186 stopped
* thread #1: tid = 0x11d9b7, 0x00000001030e18d5 libSkeletonPass.so`(anonymous namespace)::SkeletonPass::runOnFunction(this=0x0000000103204a20, fn=0x0000000103501880) + 181 at Skeleton.cpp:20, queue = 'com.apple.main-thread', stop reason = step over
    frame #0: 0x00000001030e18d5 libSkeletonPass.so`(anonymous namespace)::SkeletonPass::runOnFunction(this=0x0000000103204a20, fn=0x0000000103501880) + 181 at Skeleton.cpp:20
   17         errs() << "In function " << fn.getName() << "\n";
   18
   19         for (auto& bb : fn) {
-> 20           errs() << "Basic block:\n";
   21           bb.dump();
   22         }
   23
(lldb)
Notice how at first, it didn't know what were talking about with Skeleton.cpp since that module is dynamically loaded by clang later. However, as soon as it was loaded, lldb obediently set the breakpoint we asked for!
Almost everything in LLVM has a dump() method — definitely anything descending from Value, which includes Instruction, BasicBlock, Function, and even metadata (MDNode). This is super handy to use in your passes to find out what's going on.
Protip: LLVM's C++ magic allows you to use the
<<operator with anything that has thisdumpmethod, so we could have just as easily writtenerrs() << "Basic block:\n" << bb << "\n";above. However, in the debugger, we usedump()to print to the console.
Now we can poke around a bit with LLVM. In lldb, e or p (for GDB compatibility) are just shortcuts for "evaluate expression".
(lldb) e bb.dump()

%1 = call i32 (i8*, ...)* @printf(i8* getelementptr inbounds ([14 x i8]* @.str, i32 0, i32 0))
ret void

(lldb) e fn.dump()

; Function Attrs: nounwind ssp uwtable
define void @hello() #0 {
  %1 = call i32 (i8*, ...)* @printf(i8* getelementptr inbounds ([14 x i8]* @.str, i32 0, i32 0))
  ret void
}
Because lldb leverages LLVM's own awesome parsing and JIT'ing functionality, it's possible to do all kinds of exploratory computation from the lldb prompt. The only real limitation is that you must have #include'd the headers for things you wish to work with, otherwise it probably won't have the full definition of the classes.
Viewing graphs
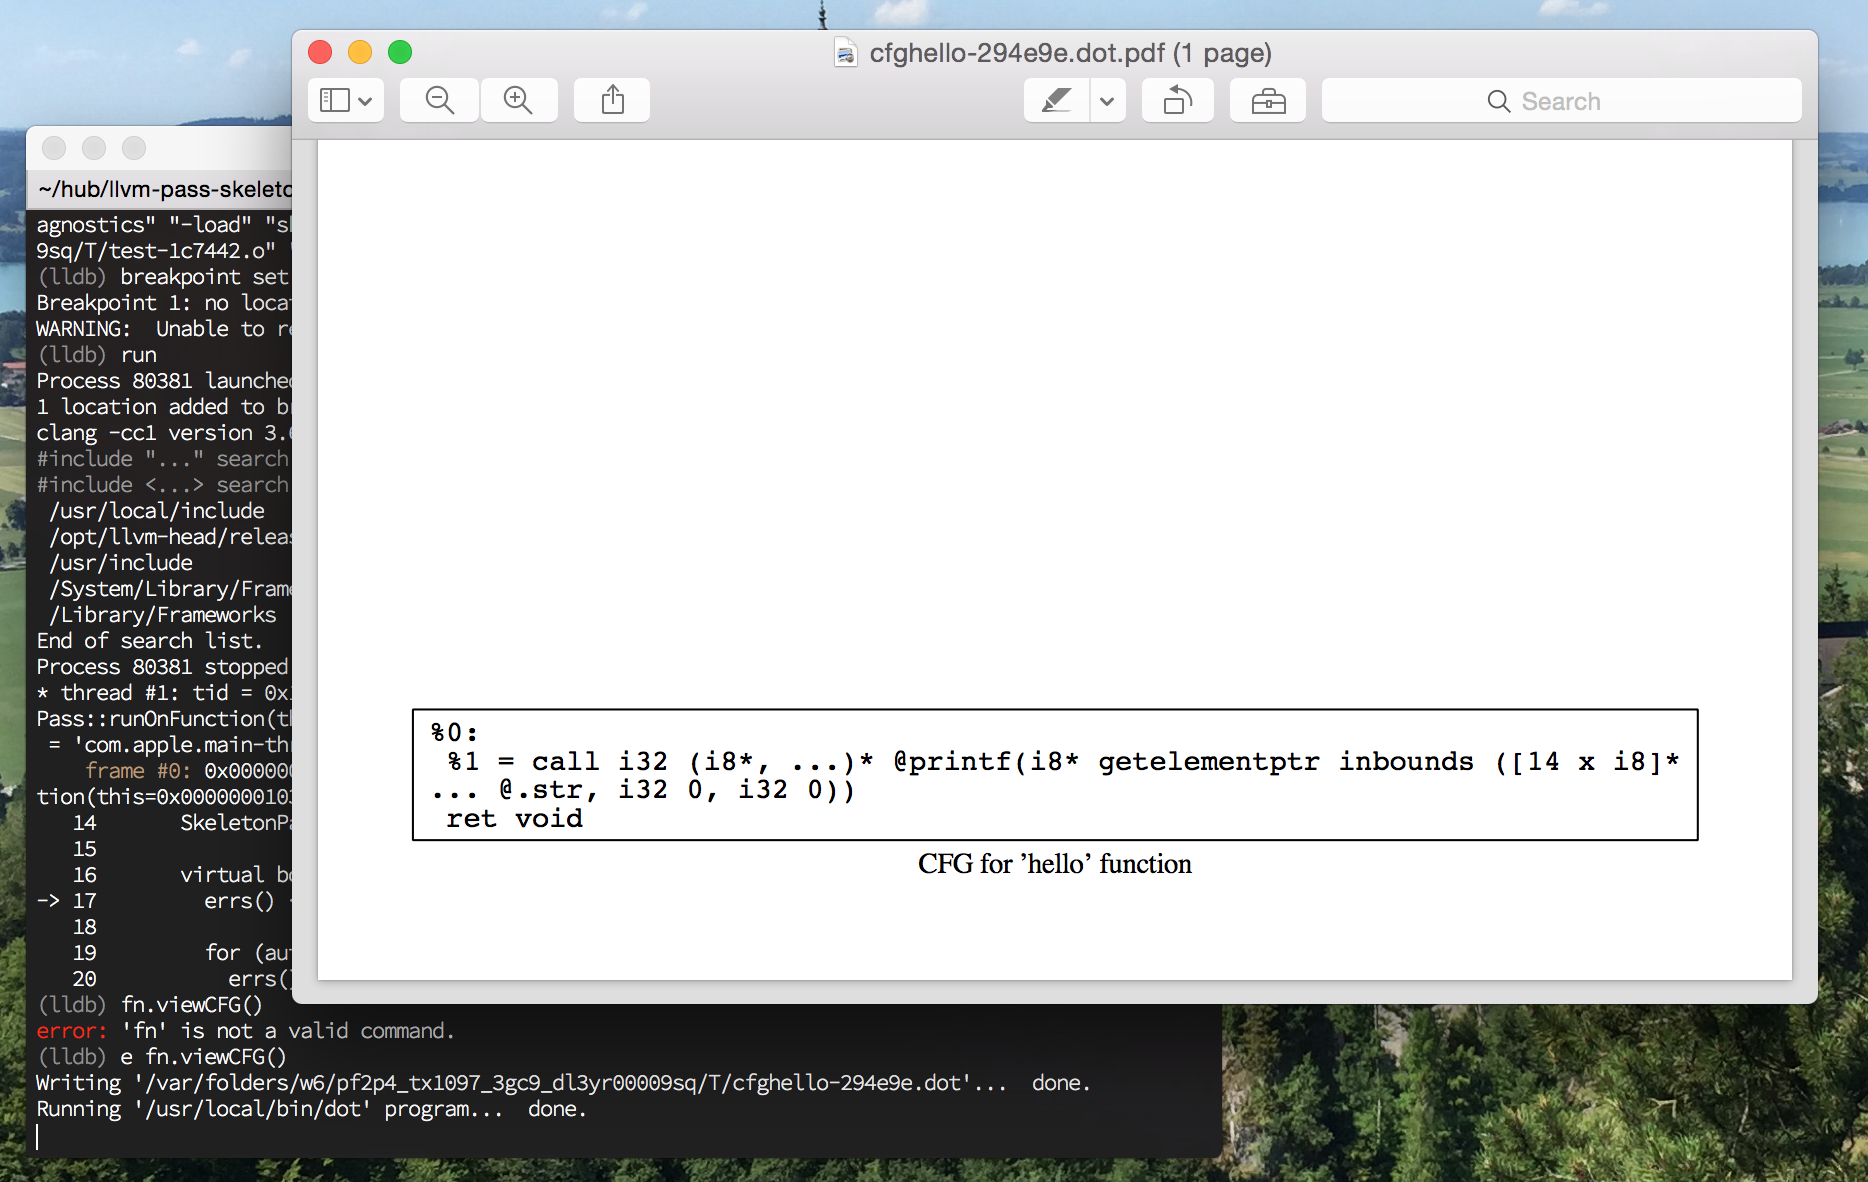
Another handy tool LLVM provides is automatic DOT graph generation for various objects. For instance, you can print the complete control-flow-graph (CFG) for a function with Function::viewCFG(). This is explained more in the programmer's manual, specifically here.
I have it on good authority (thanks Thierry!) that on OSX, if you use Homebrew, you can just do brew install graphviz and that should install the necessary libraries and tools for LLVM to do its thing.
This works particularly well from within LLDB:
(lldb) fn.viewCFG()
Writing '/var/folders/w6/pf2p4_tx1097_3gc9_dl3yr00009sq/T/cfghello-6a63ec.dot'...  done.
Running '/usr/local/bin/dot' program...  done.
As with everything else in LLVM, the DOT graph printer is built to be extended, so you can define custom graphs for debugging your passes, or for visualizing the output of your tool. A good place to start looking is in the documentation for DefaultDOTGraphTraits.
Getting source/line info for instructions
Many times when working with LLVM IR, I've wanted to be able to map instructions back to the source code they came from. There are just a couple gotchas with mapping instructions back to their original source code file and line number, so I thought I'd spend a few sentences explaining them.
First, you need another header (this is it's location in my version of LLVM, but they seem to change these paths fairly often so YMMV):
#include <llvm/IR/DebugInfo.h>
Then you just need to get the metadata for the instruction and extract the location information:
Instruction *inst = ...;
MDNode *md = inst->getMetadata("dbg");
DILocation loc(md);
unsigned int line = loc.getLineNumber();
StringRef file = loc.getFilename();
StringRef dir = loc.getDirectory();
errs() << *inst <<  " ; file: " << file << ", line: " << line << "\n";
Update: The way to get location information has become simpler in newer versions of LLVM:
DILocation *loc = inst->getDebugLoc();
If you go ahead and try this, odds are good your first run will look something like this:
$ clang -Xclang -load -Xclang skeleton/libSkeletonPass.so ~/scratch/test.c
Function: main
Basic block:
  %1 = alloca i32, align 4 ; file: , line: 0
  %2 = alloca i32, align 4 ; file: , line: 0
  %3 = alloca i8**, align 8 ; file: , line: 0
  store i32 0, i32* %1 ; file: , line: 0
  store i32 %argc, i32* %2, align 4 ; file: , line: 0
  store i8** %argv, i8*** %3, align 8 ; file: , line: 0
  call void @hello() ; file: , line: 0
  ret i32 0 ; file: , line: 0
The big gotcha with source code info is that you need to instruct Clang/LLVM to generate this metadata, which it only does if you've specified that you want "debug symbols" or "debug info" by passing the -g flag (if you're not already in the habit of just always passing this flag to gcc/clang, now's the time to start).
$ clang -g -Xclang -load -Xclang skeleton/libSkeletonPass.so ~/scratch/test.c
Function: hello
Basic block:
  %1 = call i32 (i8*, ...)* @printf(i8* getelementptr inbounds ([14 x i8]* @.str, i32 0, i32 0)), !dbg !18 ; file: test.c, line: 4
  ret void, !dbg !19 ; file: test.c, line: 5
  ret void, !dbg !19
Function: main
Basic block:
  %1 = alloca i32, align 4 ; file: , line: 0
  %2 = alloca i32, align 4 ; file: , line: 0
  %3 = alloca i8**, align 8 ; file: , line: 0
  store i32 0, i32* %1 ; file: , line: 0
  store i32 %argc, i32* %2, align 4 ; file: , line: 0
  call void @llvm.dbg.declare(metadata !{i32* %2}, metadata !18, metadata !19), !dbg !20 ; file: test.c, line: 7
  store i8** %argv, i8*** %3, align 8 ; file: , line: 0
  call void @llvm.dbg.declare(metadata !{i8*** %3}, metadata !21, metadata !19), !dbg !22 ; file: test.c, line: 7
  call void @hello(), !dbg !23 ; file: test.c, line: 9
  ret i32 0, !dbg !24 ; file: test.c, line: 11
  ret i32 0, !dbg !24
Note: Even after running with
-g, some instructions still won't have source location metdata. That's because they don't meaningfully correspond to a line number. This is true for theallocainstructions inserted by the compiler for stack variables, and probably for any code you've generated yourself. Or for highly-optimized code. So don't fret if you see it — and don't count on them being available everywhere.
Much more detailed instructions for all of this can be found in the LLVM Source Level Debugging docs.
I hope that these tips were helpful. If you have other time-saving tricks in LLVM, just let me know on Twitter!
A couple tips for debugging LLVM. Pairs nicely with @samps's fantastic intro to LLVM.
http://t.co/nza1ruk9SJ
— Brandon Holt (@holtbg) August 4, 2015